
Last time we discussed 2x2 tables and test result distribution curves. Many biostatistics questions on Step 1 will be based on being able to extract information from these types of figures. Here we will apply the concepts of sensitivity and specificity to a typical ‘moderate difficulty’ Step 1 problem:
A researcher develops a new assay to diagnose HIV. He believes that his laboratory test is superior to current ELISA and Western blotting techniques and wishes to use the test in a sample population. The assay quantitatively measures HIV-specific proteins in patients’ serum. The researcher chooses point A as the threshold for a positive test.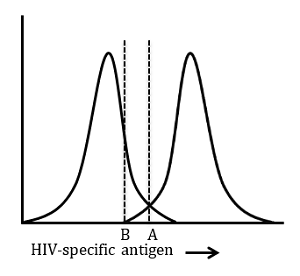
To be able answer this type of question correctly, one must first be able to assign values to the various areas under each curve. Take a look below:
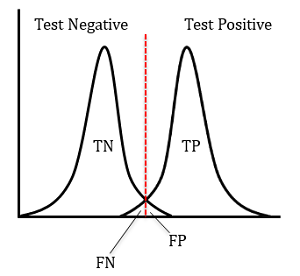 The information implicit in the figure is shown. For brevity we will discuss the left half of the diagram. To the left of the red dotted line are patients who test negative for HIV. Most patients who are HIV negative test negative and thus they are true negatives (TN). On a continuous spectrum, there will be some test values that return a negative result when the patient actually has HIV. These patients are false negatives (FN). The same reasoning can be applied to assign true positives (TP) and false positives (FP). If these concepts are unfamiliar, I recommend reviewing TP, TN, FP, and FN values before continuing. Understanding how to assign these values is the crux of this type of Step 1 problem. Now the question:
Which of the following is most likely to occur if the threshold is moved from A to B?
A: No change in sensitivity or specificity
B: Increased sensitivity, decreased specificity
C: Decreased sensitivity, Increased specificity
D: Increased sensitivity, increased specificity
E: Decreased sensitivity, decreased specificity
We have already worked through the trickier part of the question. Now we can simply apply the formulas for sensitivity and specificity:
Sensitivity: TP/(TP+FN)
Specificity: TN/(TN+FP)
Since moving the dotted line from A to B decreases the number of FNs while increasing the number of FPs, sensitivity increases whereas specificity decreases. Thus, the correct answer is B.
A brief note: both of these values are intrinsic properties of a given diagnostic test; they do not change with disease prevalence. More importantly, note the inverse relationship between sensitivity and specificity. Given any change in a test threshold, sensitivity and specificity will always vary inversely.
The sample problem here is one of the more difficult biostatistics questions encountered on Step 1. While reviewing biostatistics for the exam, be able to apply (and not simply memorize) definitions and formulas. Remember, Step 1 tests your ability to synthesize information and apply your knowledge.
The information implicit in the figure is shown. For brevity we will discuss the left half of the diagram. To the left of the red dotted line are patients who test negative for HIV. Most patients who are HIV negative test negative and thus they are true negatives (TN). On a continuous spectrum, there will be some test values that return a negative result when the patient actually has HIV. These patients are false negatives (FN). The same reasoning can be applied to assign true positives (TP) and false positives (FP). If these concepts are unfamiliar, I recommend reviewing TP, TN, FP, and FN values before continuing. Understanding how to assign these values is the crux of this type of Step 1 problem. Now the question:Which of the following is most likely to occur if the threshold is moved from A to B?
A: No change in sensitivity or specificity
B: Increased sensitivity, decreased specificity
C: Decreased sensitivity, Increased specificity
D: Increased sensitivity, increased specificity
E: Decreased sensitivity, decreased specificity
We have already worked through the trickier part of the question. Now we can simply apply the formulas for sensitivity and specificity:
Sensitivity: TP/(TP+FN)
Specificity: TN/(TN+FP)
Since moving the dotted line from A to B decreases the number of FNs while increasing the number of FPs, sensitivity increases whereas specificity decreases. Thus, the correct answer is B.
A brief note: both of these values are intrinsic properties of a given diagnostic test; they do not change with disease prevalence. More importantly, note the inverse relationship between sensitivity and specificity. Given any change in a test threshold, sensitivity and specificity will always vary inversely.
The sample problem here is one of the more difficult biostatistics questions encountered on Step 1. While reviewing biostatistics for the exam, be able to apply (and not simply memorize) definitions and formulas. Remember, Step 1 tests your ability to synthesize information and apply your knowledge.
- 07 Apr 2015
- USMLE
